Data Flow Diagrams
-
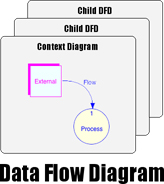
The process model is a core diagram in structured analysis and design. Also called a data flow diagram (DFD), it shows the flow of information through a system. Each process transforms inputs into outputs. Flow lines represent data flowing between nodes including processes, external entities and data stores.
The model generally starts with a context diagram showing the system as a single process connected to external entities outside of the system boundary. This process explodes to a lower level DFD that divides the system into smaller parts and balances the flow of information between parent and child diagrams. Many diagram levels may be needed to express a complex system.
Process Specifications
Primitive processes don't explode to a child diagram. They are usually described in a connected textual specification. This text is sometimes referred to as a mini-spec or process specification. It textually describes how the outputs are generated from the inputs.
Data Dictionary
When drawing data flow diagrams, the designer adds an entry for each data flow or store into a data dictionary. The data dictionary integrates the stack of diagrams into a cohesive model by defining all the names and data composition.
Verification and Balance Reports
The balancing process ensures that data is conserved between diagram levels. If flow A enters a parent process, its child diagram should have flow A coming into that diagram. Likewise flow B leaving the child diagram should balance with flow B leaving the parent process. Data decomposition can occur within the data dictionary so flow A into the parent process will balance if flows X and Y enter the child diagram and A = X + Y in the data dictionary.
Yourdon/DeMarco DFD
-
A Yourdon, DeMarco or Coad style DFD consists of round process nodes with a name that indicate the data transformation it performs. Curved flow lines name the data traveling between nodes.
A Yourdon/DeMarco style DFD may include both data flow (solid lines) and control flow (dotted lines) as specified in the Hatley/Pirbhai method. This DFD style is typically used in real-time system analysis and design.
Gane & Sarson DFD
-
The Gane & Sarson style DFD is typically used for information systems. Process nodes are named round rectangles. Flows names are adjacent to perpendicular lines. Here we show the flow of information in a small software company.
Return to Software Models